I left Germany in 2000. Since then I have helped a great many people make the same move, and the first question is almost always the same: why Latin America, of all places? Why not Portugal, Dubai, Thailand or Cyprus?
This page is my answer, and it is not a brochure. Latin America is not a paradise, it is a trade-off. You give up things that are taken for granted in Europe, and in return you get things Europe no longer has. Whether that trade works for you is something you can only decide with both sides on the table. That is why the uncomfortable half is in every single chapter, not in the small print at the end.
Every number on this page has a primary source, a reference year and a retrieval date. Where a source could not be reached, this page says so openly instead of hiding it.
Chapter 1
Abundance
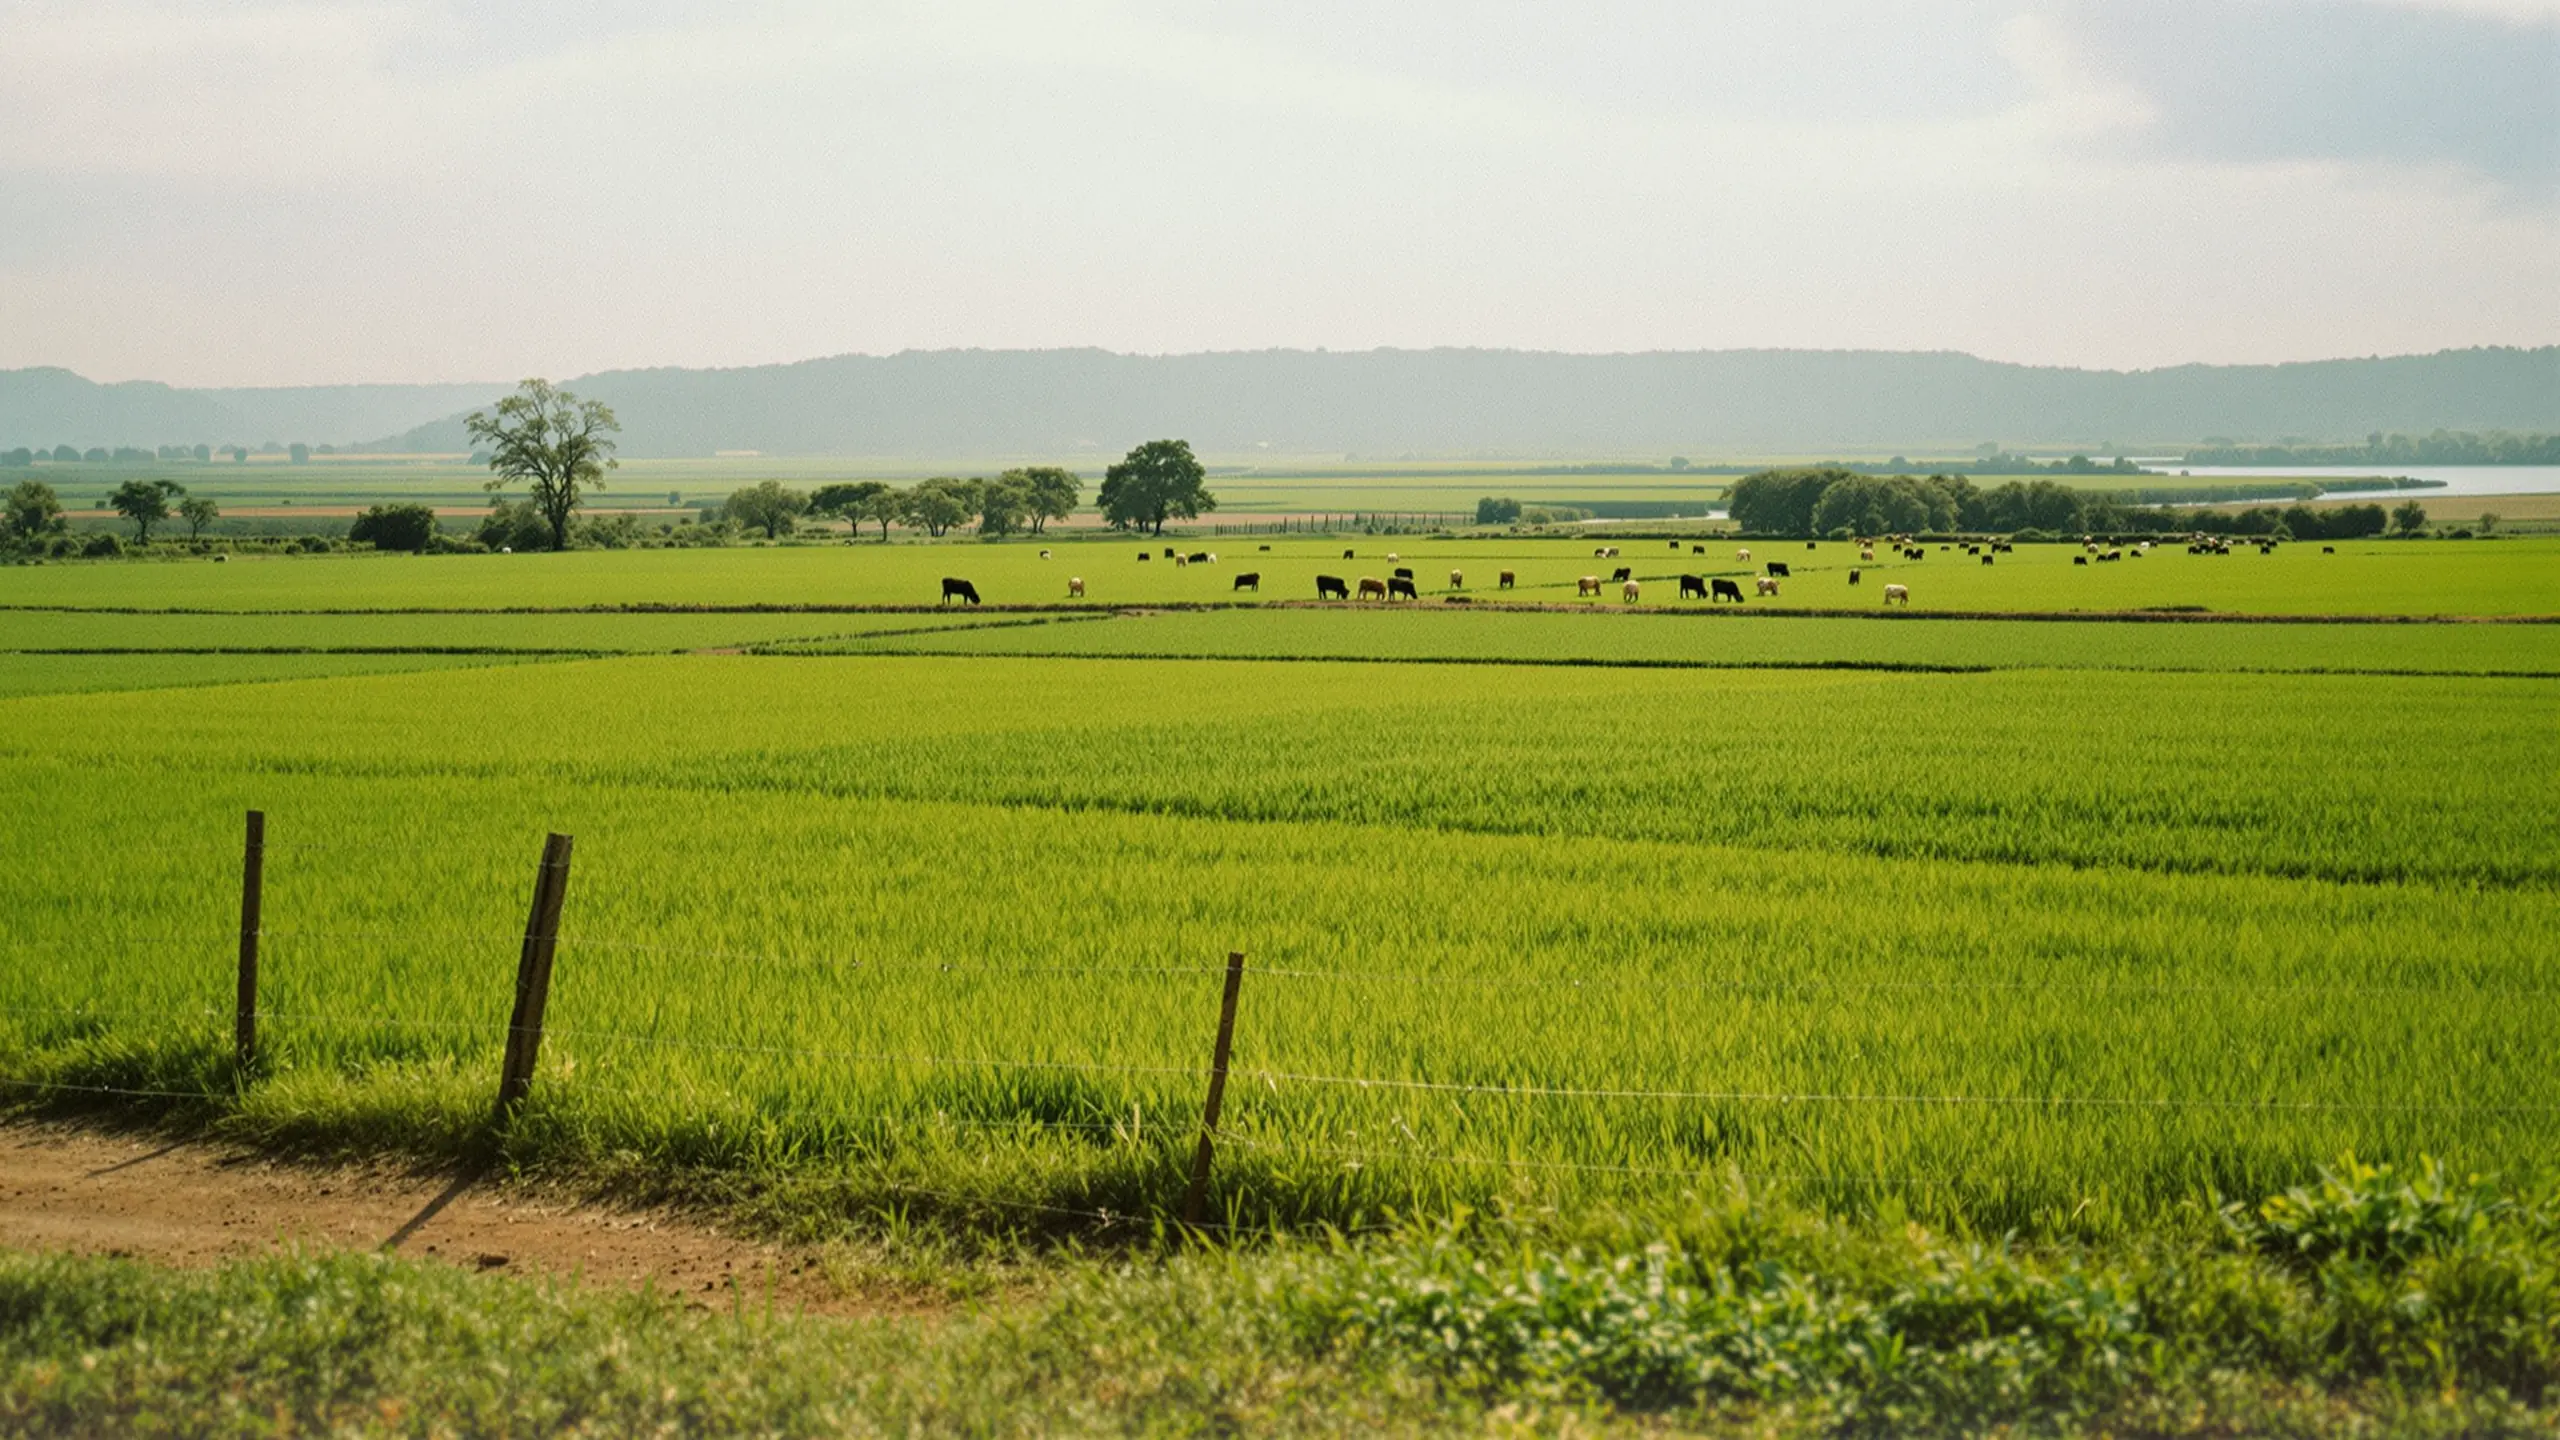
For years the European debate has revolved around scarcity: gas, electricity, grain, fertiliser, water in summer, building land, housing, skilled workers. We have learned to plan around shortage, to manage it and to read it as a moral question. It is worth pausing for a moment to see that this scarcity is not a law of nature but a feature of our half of the world.
Start with energy. The United Kingdom covers 47.6% of its energy use with net imports. North America is the exception among rich countries: the United States produces 9.8% more energy than it uses, Canada 95.0% more. Several Latin American countries are in the same position. Colombia sits at minus 142.0%: the country produces far more energy than it uses. So does Ecuador, so does Brazil, and Paraguay and Argentina cover practically all of their own needs.
And because sentences like that quickly get too big, here is the caveat that belongs with it: this does not hold for all of Latin America. Chile, Costa Rica, El Salvador and Uruguay are net importers of energy, Panama to an extreme degree. Anyone who tells you the whole continent is energy self-sufficient has not read the table.
Twelve countries we work in, with the United Kingdom, the United States and Canada as reference rows.
For energy, “imported” means the country has to buy energy in, “surplus” means it produces more than it uses. The food share shows how much of a country’s merchandise exports it earns with food.
| Country | Net energy | Food share of exports | Arable land per person | Fresh water per person |
|---|---|---|---|---|
| Argentina | 0.4% imported | 49.0% | 0.89 ha | 6,431 m³ |
| Brazil | 13.7% surplus | 40.7% | 0.26 ha | 26,918 m³ |
| Chile | 62.3% imported | 22.7% | 0.07 ha | 45,262 m³ |
| Costa Rica | 60.4% imported | 32.3% | 0.03 ha | 22,236 m³ |
| Ecuador | 69.4% surplus | 53.7% | 0.06 ha | 24,821 m³ |
| El Salvador | 59.5% imported | 22.9% | 0.11 ha | 2,489 m³ |
| Colombia | 142.0% surplus | 18.1% | 0.05 ha | 41,459 m³ |
| Mexico | 21.6% imported | 7.5% | 0.15 ha | 3,180 m³ |
| Panama | 171.2% imported | 73.6% | 0.13 ha | 31,040 m³ |
| Paraguay | 4.7% surplus | 69.1% | 0.67 ha | 17,307 m³ |
| Peru | 12.2% imported | 21.2% | 0.12 ha | 49,021 m³ |
| Uruguay | 46.2% imported | 65.3% | 0.65 ha | 27,190 m³ |
| United Kingdom | 47.6% imported | 6.7% | 0.09 ha | 2,144 m³ |
| United States | 9.8% surplus | 9.0% | 0.45 ha | 8,437 m³ |
| Canada | 95.0% surplus | 13.6% | 0.95 ha | 73,170 m³ |
- Net energy
- 0.4% imported
- Food share of exports
- 49.0%
- Arable land per person
- 0.89 ha
- Fresh water per person
- 6,431 m³
- Net energy
- 13.7% surplus
- Food share of exports
- 40.7%
- Arable land per person
- 0.26 ha
- Fresh water per person
- 26,918 m³
- Net energy
- 62.3% imported
- Food share of exports
- 22.7%
- Arable land per person
- 0.07 ha
- Fresh water per person
- 45,262 m³
- Net energy
- 60.4% imported
- Food share of exports
- 32.3%
- Arable land per person
- 0.03 ha
- Fresh water per person
- 22,236 m³
- Net energy
- 69.4% surplus
- Food share of exports
- 53.7%
- Arable land per person
- 0.06 ha
- Fresh water per person
- 24,821 m³
- Net energy
- 59.5% imported
- Food share of exports
- 22.9%
- Arable land per person
- 0.11 ha
- Fresh water per person
- 2,489 m³
- Net energy
- 142.0% surplus
- Food share of exports
- 18.1%
- Arable land per person
- 0.05 ha
- Fresh water per person
- 41,459 m³
- Net energy
- 21.6% imported
- Food share of exports
- 7.5%
- Arable land per person
- 0.15 ha
- Fresh water per person
- 3,180 m³
- Net energy
- 171.2% imported
- Food share of exports
- 73.6%
- Arable land per person
- 0.13 ha
- Fresh water per person
- 31,040 m³
- Net energy
- 4.7% surplus
- Food share of exports
- 69.1%
- Arable land per person
- 0.67 ha
- Fresh water per person
- 17,307 m³
- Net energy
- 12.2% imported
- Food share of exports
- 21.2%
- Arable land per person
- 0.12 ha
- Fresh water per person
- 49,021 m³
- Net energy
- 46.2% imported
- Food share of exports
- 65.3%
- Arable land per person
- 0.65 ha
- Fresh water per person
- 27,190 m³
United Kingdom
- Net energy
- 47.6% imported
- Food share of exports
- 6.7%
- Arable land per person
- 0.09 ha
- Fresh water per person
- 2,144 m³
United States
- Net energy
- 9.8% surplus
- Food share of exports
- 9.0%
- Arable land per person
- 0.45 ha
- Fresh water per person
- 8,437 m³
Canada
- Net energy
- 95.0% surplus
- Food share of exports
- 13.6%
- Arable land per person
- 0.95 ha
- Fresh water per person
- 73,170 m³
Source: World Bank, energy imports, net (% of energy use), series EG.IMP.CONS.ZS, from IEA energy balances. Data: 2022 to 2024, by country (rows for the United Kingdom, the United States and Canada retrieved on 25 October 2026). Retrieved on 10 August 2026. Food share: World Bank, food exports (% of merchandise exports), series TX.VAL.FOOD.ZS.UN, from UN Comtrade. Arable land: World Bank, arable land (hectares per person), series AG.LND.ARBL.HA.PC, from FAO. Fresh water: World Bank, renewable internal freshwater resources per capita, series ER.H2O.INTR.PC, from FAO AQUASTAT.
The second column is the real surprise. Paraguay earns 69.1% of its merchandise exports from food, Uruguay 65.3%, Ecuador 53.7%, Argentina 49.0%, Brazil 40.7%. The United Kingdom is at 6.7%, the United States at 9.0%, Canada at 13.6%. That is not a value judgement about industrial countries, it is a statement about dependence: in a world where food can become scarce and expensive again, you would rather live where it is produced. Panama’s high figure in this column is a special case and should not fool you: Panama’s merchandise exports are small because the country lives off the canal, logistics and services, so the share looks bigger than its farming really is.
Then the land itself. Argentina has 0.89 hectares of arable land per person, Paraguay 0.67, Uruguay 0.65. The United Kingdom has 0.09: that is the difference between a continent where land is a resource and an island where land is a planning question. The United States has 0.45, and Canada, at 0.95, has even more per person than Argentina, so if you come from North America the hectares alone will not impress you. What matters is access: in Argentina, Paraguay and Uruguay you can buy land as a foreigner, in your own name, and then actually use it. That is not a legal trick but the normal case, and it sets the region fundamentally apart from much of Asia.
With water the picture gets even clearer. Peru has around 49,021 cubic metres of renewable fresh water per person per year, Chile 45,262, Colombia 41,459. The United Kingdom has 2,144, the United States 8,437. Canada, at 73,170, is in a class of its own and outdoes even Peru. Beneath Brazil, Argentina, Paraguay and Uruguay lies the Guaraní Aquifer as well, one of the largest groundwater systems in the world: around 1,100,000 square kilometres in extent, with a total volume of about 30,000 cubic kilometres.
Here too, the honest caveat: El Salvador and Mexico are short of water, with 2,489 and 3,180 cubic metres per person respectively, and Chile’s top figure is a national average that hides the drought in the north. Water wealth in Latin America is a question of region, not of national borders.
What is happening with energy in detail is just as remarkable. In 2025 Guyana produced an annual average of around 750,000 barrels of crude oil a day and has gone from nothing to a significant producer within a few years. Paraguay generates practically all of its electricity from hydropower: the Itaipú dam alone produced 72,879 gigawatt hours in 2025, of which 25,768 gigawatt hours went to Paraguay. A country of just over seven million people sits on one of the largest hydropower plants on earth.
And in the Andes lies what the industrial policy of the next twenty years will be fought over. In 2025 Chile mined an estimated 5.3 million tonnes of copper, Peru 2.7 million tonnes, together around a third of world output of 23 million tonnes. Of the known copper reserves, Chile, Peru and Mexico together hold 32% of the world’s total. For lithium, Chile and Argentina together hold 37% of global reserves.
You can romanticise this wealth, and you should not. Natural resources do not automatically make a country rich, at first they only make it interesting, and this region has plenty of examples that ended badly. For you as a private individual, though, the meaning is different and simpler: you are not moving to a region whose very livelihood depends structurally on supply chains from other parts of the world working. You are moving to where energy, food, water and land are physically there. That is a very old-fashioned kind of security, and it is coming back into fashion.
Chapter 2
Young

In Canada the median age is 40.8 years, in the United Kingdom 40.2, in the United States 38.7. In Paraguay it is 27.3, in El Salvador 28.4, in Ecuador 29.7, in Mexico 30.0. That is a gap of 13 years between Canada and Paraguay, and it is not a statistical curiosity, it is the difference between two societies.
Half the population is younger than this figure, the other half older.
The scale starts at 25, not at zero, so that the gaps between countries are visible. The amber dots are the three reference countries: the United Kingdom, the United States and Canada.
- Paraguay27.3
- El Salvador28.4
- Ecuador29.7
- Mexico30.0
- Panama30.6
- Peru30.6
- Colombia33.0
- Argentina33.3
- Brazil35.3
- Costa Rica35.7
- Uruguay36.7
- Chile37.4
- United States38.7
- United Kingdom40.2
- Canada40.8
Source: United Nations, Department of Economic and Social Affairs, World Population Prospects 2024, file GEN/01. Data: estimates to 2023, medium variant from 2024 (rows for the United Kingdom, the United States and Canada retrieved on 25 October 2026). Retrieved on 10 August 2026.
In daily life you notice this in three ways. First, services are affordable, because there are people to provide them: trades, care, childminding, repairs. Second, the pension system is not yet eating up the state budget, which means the tax burden does not face the same structural upward pressure as it does in much of Europe. Third, and this is harder to measure, the mood is different. A society with many young people looks forward, even when it is poorer. An ageing society manages what it already has.
Now the other half, and it matters because almost nobody mentions it: birth rates in Latin America have collapsed, and faster than in Europe.
Total fertility rate, sorted by today’s value.
Below 2.1 children per woman a population shrinks in the long run without immigration. The grey bar shows 1990, the green bar the value for 2026.
- Paraguay4.572.37
- Panama3.072.07
- Peru3.911.93
- Mexico3.441.85
- Ecuador3.681.78
- El Salvador3.961.74
- United States2.071.63
- Colombia3.001.61
- Brazil2.901.59
- United Kingdom1.831.53
- Argentina3.031.51
- Uruguay2.481.38
- Canada1.701.33
- Costa Rica3.171.31
- Chile2.581.12
Source: United Nations, Department of Economic and Social Affairs, World Population Prospects 2024, file GEN/01. Data: estimates to 2023, medium variant from 2024 (rows for the United Kingdom, the United States and Canada retrieved on 25 October 2026). Retrieved on 10 August 2026.
Look at Chile. In 1990 the fertility rate was 2.58 children per woman, today it is 1.12. That is lower than the United Kingdom at 1.53 and even lower than Canada at 1.33. Costa Rica, at 1.31, is below Canada as well, and Uruguay, at 1.38, only just above it. Of the twelve countries, only Paraguay at 2.37 and Panama at 2.07 are still above replacement level.
What does that mean for you? It means the youth of these societies is a window, not a permanent state. Today’s age structure is the result of the birth rates of thirty years ago. The countries with the youngest median today will, in two decades, be where southern Europe is now, and some will age faster than Europe did, because the fall was steeper. I think it is more honest, and also more convincing, to say so than to claim a forever that does not exist.
In practice it also means something for your planning. If you move abroad at fifty, in the countries with the youngest median you will spend the next twenty years in a society that is still working, still building and still having children. If you move to Chile or Uruguay at fifty, you are moving into a society that is on the same demographic path as Europe, just ten years behind. Both can be right, but they are different decisions, and you should know which one you are making.
The second difference lies in what states do with this demography. In Europe, ageing has been offset by immigration for years, while the rules for settling there keep getting tighter. In Latin America it is the other way round: the countries do not need immigration yet and still let you in, because their residence laws date from a time when immigration was seen as a gain and not as a problem. That is a window tied to demography, and it will change over the coming decades.
In passing, the same dataset disposes of an old reservation. Life expectancy is 81.7 years in Chile and 81.4 years in Costa Rica, against 81.8 years in the United Kingdom, 83.1 in Canada and 79.8 in the United States. The gap is smaller than most people assume: Chile and Costa Rica practically match Britain, and both are ahead of the United States.
Chapter 3
Affordable
A lot of nonsense is written about the cost of living, mostly based on websites where users enter prices themselves. There is no reliable official source for a shopping basket in individual cities. What does exist is the World Bank’s International Comparison Program, which makes the price levels of whole countries comparable. That is what the table shows, and nothing else.
Purchasing power parity relative to the market exchange rate, with the United States at 100.
A value of 35 means that the same basket of goods and services costs about 35% of what it costs in the United States. These are national averages, not city comparisons. The United Kingdom, the United States and Canada are the reference rows.
| Country | Price level (US = 100) | GDP per person, PPP (int. $) |
|---|---|---|
| Colombia | 35 | 22,640 |
| Paraguay | 35 | 20,181 |
| El Salvador | 42 | 14,101 |
| Ecuador | 43 | 16,757 |
| Argentina | 46 | 32,587 |
| Brazil | 46 | 23,433 |
| Chile | 46 | 37,774 |
| Panama | 46 | 43,902 |
| Peru | 48 | 18,816 |
| Mexico | 54 | 25,868 |
| Costa Rica | 60 | 33,815 |
| Uruguay | 66 | 38,315 |
| Canada | 84 | 66,746 |
| United Kingdom | 85 | 64,606 |
| United States | 100 | 90,027 |
- Price level (US = 100)
- 35
- GDP per person, PPP
- 22,640
- Price level (US = 100)
- 35
- GDP per person, PPP
- 20,181
- Price level (US = 100)
- 42
- GDP per person, PPP
- 14,101
- Price level (US = 100)
- 43
- GDP per person, PPP
- 16,757
- Price level (US = 100)
- 46
- GDP per person, PPP
- 32,587
- Price level (US = 100)
- 46
- GDP per person, PPP
- 23,433
- Price level (US = 100)
- 46
- GDP per person, PPP
- 37,774
- Price level (US = 100)
- 46
- GDP per person, PPP
- 43,902
- Price level (US = 100)
- 48
- GDP per person, PPP
- 18,816
- Price level (US = 100)
- 54
- GDP per person, PPP
- 25,868
- Price level (US = 100)
- 60
- GDP per person, PPP
- 33,815
- Price level (US = 100)
- 66
- GDP per person, PPP
- 38,315
Canada
- Price level (US = 100)
- 84
- GDP per person, PPP
- 66,746
United Kingdom
- Price level (US = 100)
- 85
- GDP per person, PPP
- 64,606
United States
- Price level (US = 100)
- 100
- GDP per person, PPP
- 90,027
Source: World Bank, International Comparison Program: purchasing power parity (PA.NUS.PPP) relative to the market exchange rate (PA.NUS.FCRF). Data: 2024 (rows for the United Kingdom, the United States and Canada retrieved on 25 October 2026). Retrieved on 10 August 2026. Economic output per person: World Bank, GDP per capita, PPP (current international dollars), series NY.GDP.PCAP.PP.CD.
The range is the point. Paraguay and Colombia sit at around 35% of the US price level, Ecuador and El Salvador at 43% and 42%, Argentina, Brazil, Chile, Panama and Peru between 46% and 48%. For comparison, the United Kingdom is at 85% and Canada at 84%. If you arrive with an income, a pension or investment returns earned in a richer economy, you are not shifting your standard of living, you are shifting your room for manoeuvre.
In practice this means: help in the house stops being a luxury and becomes normal. Care for elderly relatives is affordable instead of setting off a family crisis. Building costs a fraction, not only in materials but above all in labour. A dentist’s appointment, an MRI scan or an operation in the private sector costs less in many of these countries than the excess or deductible many people pay at home, and you get it in days instead of months. And land has prices at which an ordinary saver can actually become an owner, instead of serving a bank for forty years.
When you buy property there is a second effect that many people only understand once they are on the ground. In much of Europe you pay not only for the plot and the building but for a whole tower of requirements: energy certificates, parking quotas, fire safety reports, heritage conditions, setback rules, procedures that take years. In Latin America that tower is much lower, and that feeds through to the price more strongly than the difference in wages. You are not just buying cheaper construction, you are buying shorter paths.
Now the caveats, and there are four.
First, not every country is cheap. Uruguay sits at 66% of the US level, Costa Rica at 60%. If you come from the United States, at 100% the most expensive country in the table, you will find both cheap. From the United Kingdom, at 85%, or Canada, at 84%, the gap is smaller but still there. If you come from somewhere with prices well below the US level, you may not find them cheap at all. Panama City is more expensive than the Panamanian national average suggests, because a national figure always includes the provinces.
Second, cheap is a function of the exchange rate, and the rate can turn against you. Argentina was the cheapest country in the region for years and then suddenly was not, without anything changing on the ground except the rate. If you plan your living costs in one currency and draw your income in another, you carry a risk that has nothing to do with the country.
Third, a low price level is not a promise of prosperity. The second column of the table shows why: economic output per person in these countries is well below that of the reference countries. The price level is low because local incomes are low. You are using a gap. That is legitimate, it is the reason millions of people do the same sum, but it should be called by its name rather than pretending Latin America is simply cheaper for everyone.
Fourth, not everything is cheaper, only almost everything. Anything imported costs more than at home, often a lot more: cars, electronics, brand-name clothing, tools, kitchen appliances, imported food. In several of these countries a used mid-range car costs a multiple of what you are used to paying, because duties and taxes on imports fill the treasury. If your standard of living is built from international brands, you will save little in the end. If you live locally, you will save a great deal. That is less a question of price than of lifestyle.
Chapter 4
Christian, Western, familiar
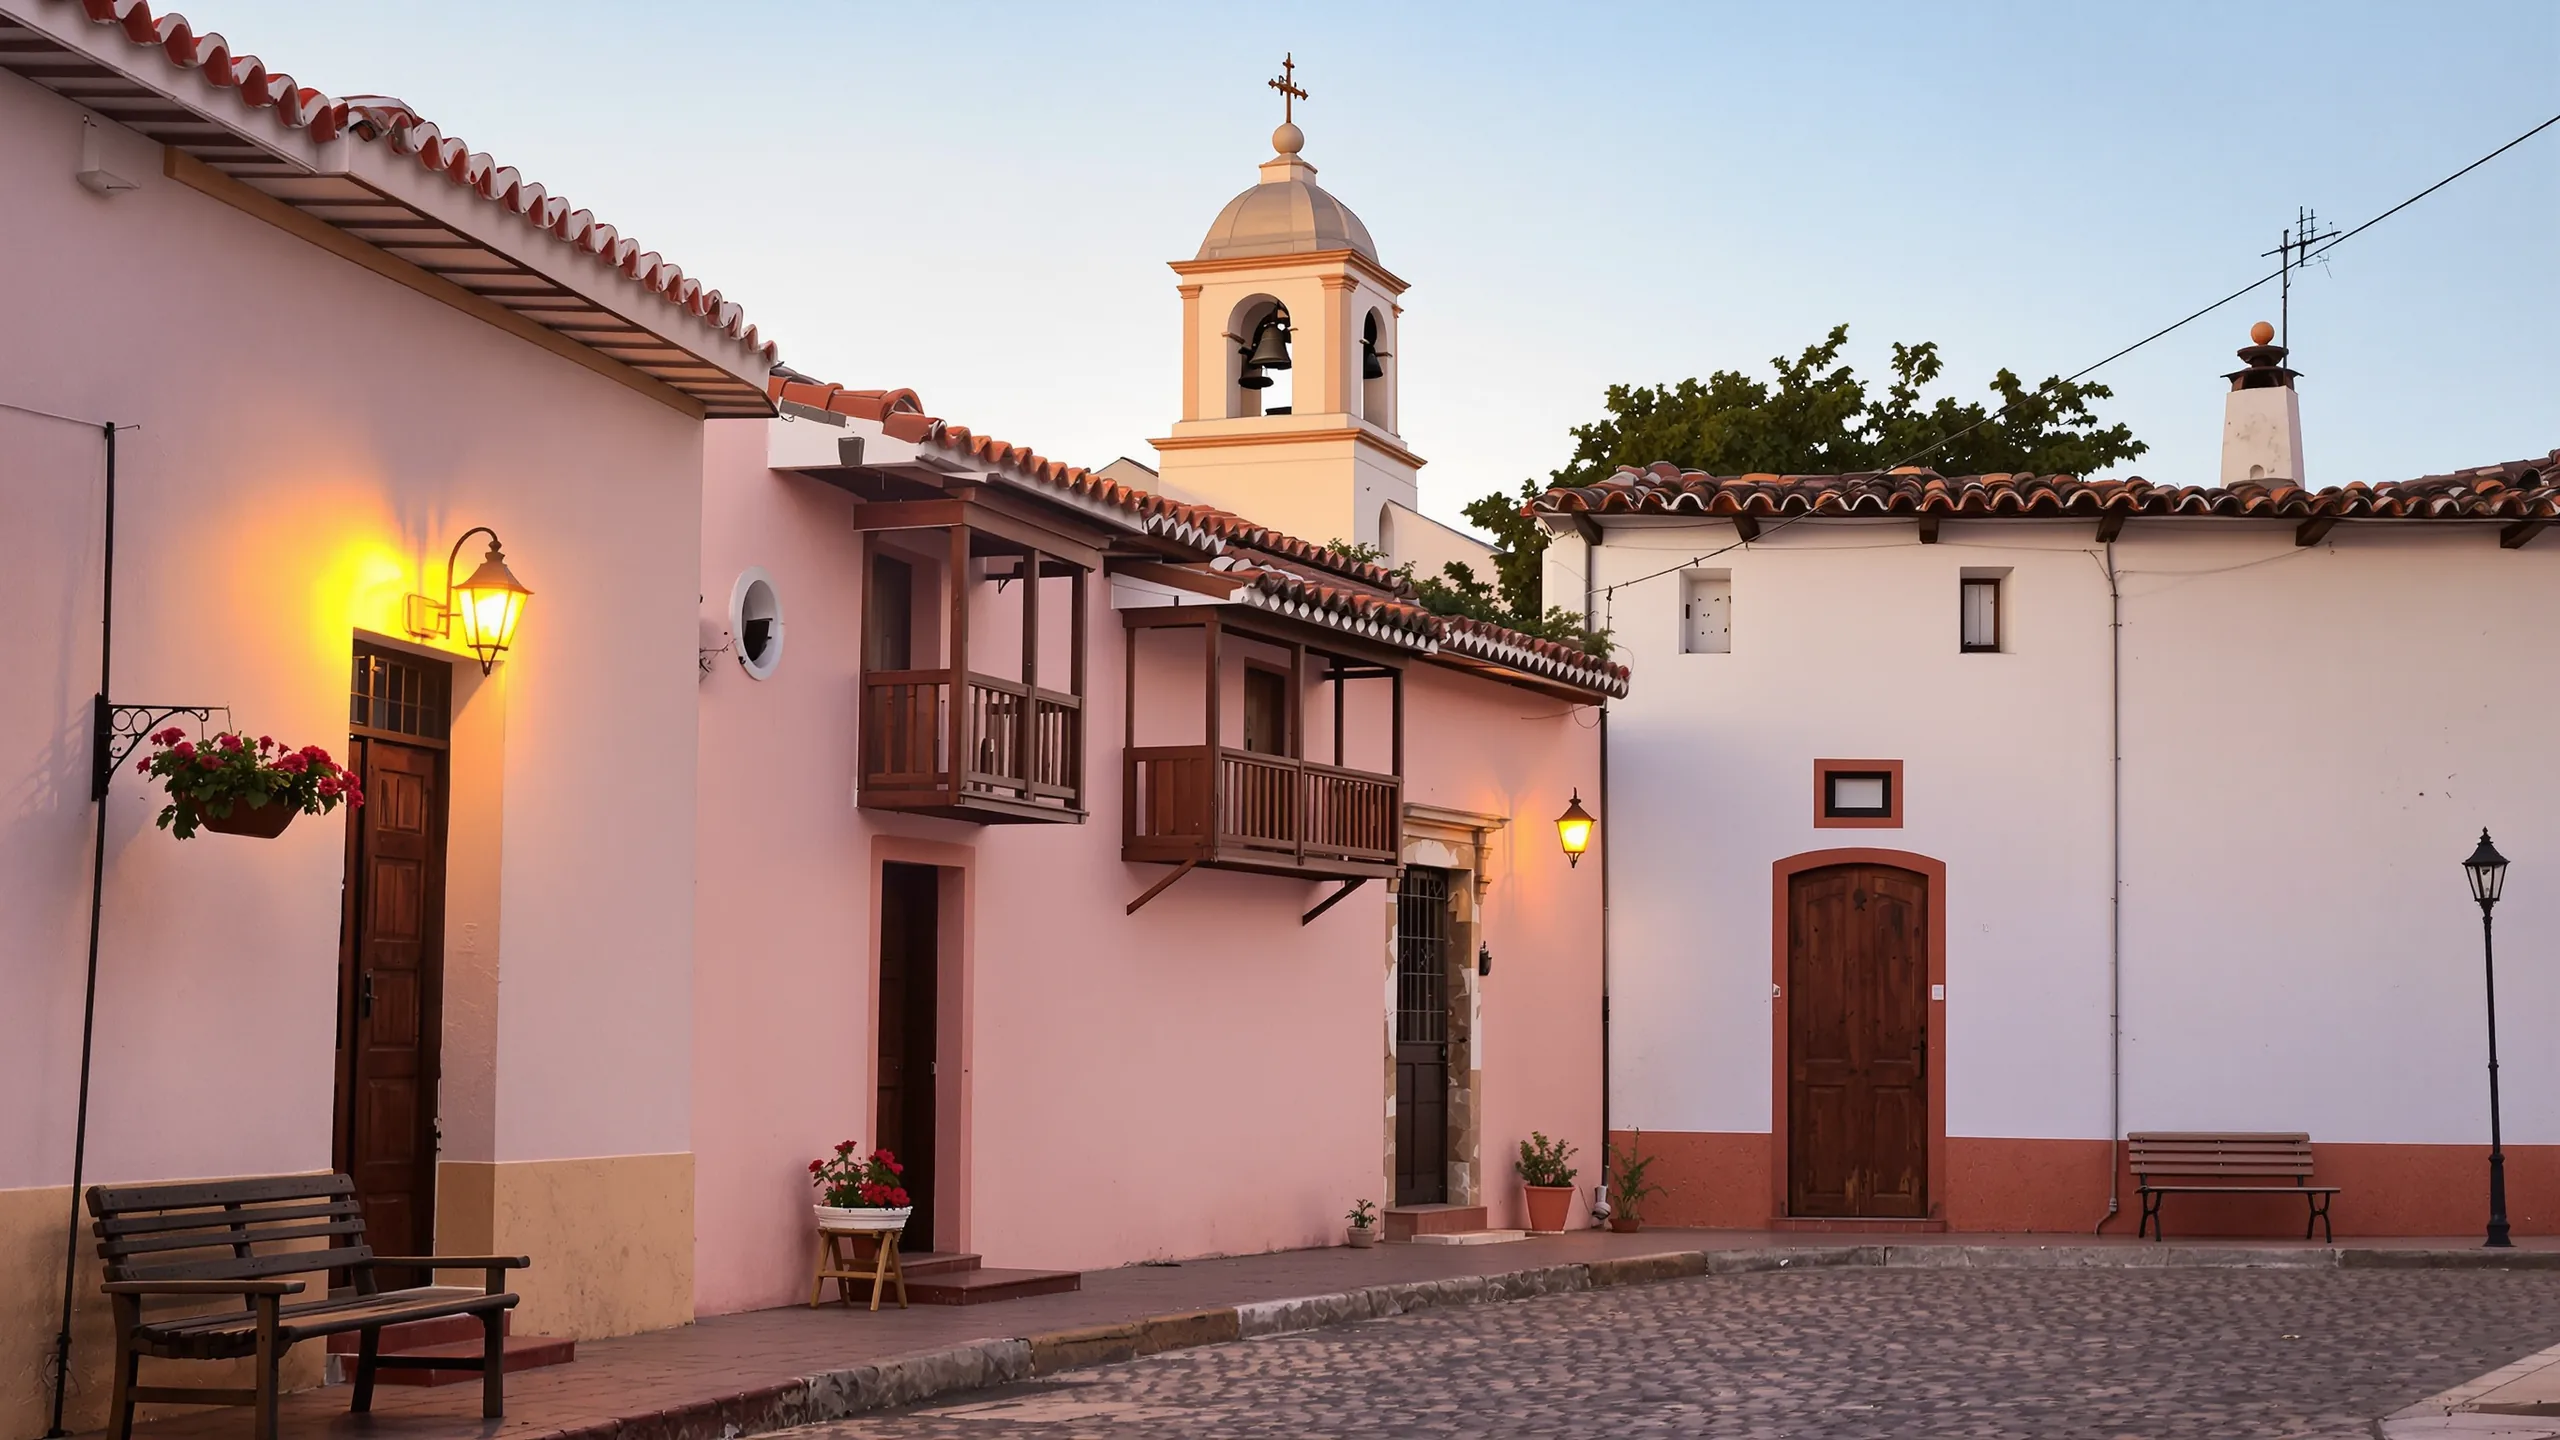
This is the chapter that is hardest to measure and easiest to feel. Latin America belongs to the same civilisation as Europe, just in a different version. The same religion, the same alphabet, the same Roman law tradition, the same calendar, the same holidays, the same week with the same Sunday. You are a foreigner there, but not an outsider.
That sounds trivial until you make the comparison. If you move to Bangkok, Dubai or Doha, you live in a society whose basic assumptions people are still explaining to you after ten years. If you move to Asunción, Medellín or Montevideo, you find a country that runs on the same basic patterns as the one you come from: contracts, notaries, land registries, courts, municipalities, parishes, schools, clubs. The institutions have the same names, they just work more slowly and more personally.
The legal side of this is regularly underestimated. The legal systems of Latin America come from the same root as those of continental Europe: Roman law, passed on through the Iberian codifications and the Napoleonic Code. That sounds academic, but it has very concrete consequences. There are notaries, there are public registers for land and companies, there is inheritance law with forced shares, there are contracts that hold even when the parties fall out. You have to get used to a different administrative culture, but the legal framework is written down, codified and predictable. Anyone who has tried to buy land under a legal system with a religious foundation knows how much that difference is worth.
The same goes for the calendar, and that too is more than folklore. The same week with the same day off on Sunday, the same big festivals, Christmas and Easter on the same days, the same months. You do not have to rebuild your life to fit the country’s rhythm of the year. In many other emigration destinations that is precisely the first quiet strain: your holiday is a working day there, and everyone else’s day off is not one for you.
Then there is the language, and in practical terms that is the most important point. Spanish is learnable, genuinely learnable. It uses your alphabet, it has thousands of words you already know, and it is so phonetically regular that within a few weeks you pronounce correctly what you read. I have seen adults handle government offices on their own after a year. With Thai, Arabic or Mandarin I have never seen that. Portuguese for Brazil is somewhat harder on the ear, but the same case.
And there is one more point that rarely appears on emigration websites, but that I hear constantly. For many Christian families, Latin America is closer to what they knew from home than home itself is today. Not because everyone there is devout, but because religion there is lived practice and not a remnant. Brazil’s 2022 census records 56.7% of the population aged ten and over as Roman Catholic, 26.9% as evangelical and only 9.3% with no religion. A family that values church services, church schools and a setting in which children are a natural part of the street finds what it is looking for there without having to explain itself.
These numbers also show that the region is moving in religious terms and is not preserved in aspic. The Catholic majority is shrinking, evangelical churches are growing fast, and the share with no religion is rising. In daily life that means something practical: faith is a normal topic of conversation there, not an embarrassment. People ask which church you belong to the way people elsewhere ask what sport you play. If that means nothing to you, you will find it intrusive. If you have learned at home to keep your faith to yourself, you will find it a relief.
The contrast with the Gulf is sharp at this point and worth mentioning. In the Emirates or in Qatar you are a permanent guest, with residence tied to your employer or your investment, and with naturalisation that is practically not on offer. In much of Asia you stay on the outside for good, no matter how long you stay and how well you behave. In Latin America the path to full membership is laid out, and it is short. Chapter 8 is about that.
And that is the real difference I see in clients after two or three years. In Asia and the Gulf you remain the foreigner for good, even with perfect language skills and thirty years of residence. In Latin America that stops at some point. Your neighbour no longer corrects your accent. You sit on the board of the sports club. That is not a sentimental point, it is a very practical one: a society that can take you in treats you differently from one that merely tolerates you.
The flip side belongs here just as much. Western does not mean like home. Government offices work in Spanish or Portuguese, even when it is about your tax number. Appointments are guidelines. Family comes before contract, which is pleasant as long as you belong and tiresome as long as you do not. Gender roles are more traditional than many women from Europe or North America expect. And the friendliness that strikes you so much at first is genuine courtesy and not yet friendship. If you confuse the two, you will be disappointed in the second year.
Chapter 5
On the rise
I handle this chapter with deliberate care, because this is where the most lies are told. For about a hundred years Latin America has been called the continent of the future, and that is not a compliment. Even so, something has genuinely shifted in recent years, and it belongs on the table, soberly.
Economic growth in per cent and net inflows of foreign direct investment in billions of US dollars.
A minus sign on direct investment means more capital flowed out than in that year, net. A single year says little; the orders of magnitude say a lot.
| Country | Growth 2025 | Direct investment |
|---|---|---|
| Paraguay | 6.6% | USD 1.2 bn |
| Costa Rica | 4.6% | USD 5.6 bn |
| Argentina | 4.4% | USD 3.1 bn |
| Panama | 4.4% | USD 0.9 bn |
| El Salvador | 3.9% | USD 0.8 bn |
| Ecuador | 3.7% | USD 1.3 bn |
| Peru | 3.4% | USD 10.4 bn |
| Colombia | 2.6% | USD 11.6 bn |
| Chile | 2.5% | USD 14.5 bn |
| Brazil | 2.3% | USD 77.7 bn |
| United States | 2.2% | USD 307.0 bn |
| Uruguay | 1.8% | USD 1.1 bn |
| Canada | 1.7% | USD 70.1 bn |
| United Kingdom | 1.4% | USD 37.6 bn |
| Mexico | 0.6% | USD 43.1 bn |
- Growth
- 6.6%
- Direct investment
- USD 1.2 bn
- Growth
- 4.6%
- Direct investment
- USD 5.6 bn
- Growth
- 4.4%
- Direct investment
- USD 3.1 bn
- Growth
- 4.4%
- Direct investment
- USD 0.9 bn
- Growth
- 3.9%
- Direct investment
- USD 0.8 bn
- Growth
- 3.7%
- Direct investment
- USD 1.3 bn
- Growth
- 3.4%
- Direct investment
- USD 10.4 bn
- Growth
- 2.6%
- Direct investment
- USD 11.6 bn
- Growth
- 2.5%
- Direct investment
- USD 14.5 bn
- Growth
- 2.3%
- Direct investment
- USD 77.7 bn
United States
- Growth
- 2.2%
- Direct investment
- USD 307.0 bn
- Growth
- 1.8%
- Direct investment
- USD 1.1 bn
Canada
- Growth
- 1.7%
- Direct investment
- USD 70.1 bn
United Kingdom
- Growth
- 1.4%
- Direct investment
- USD 37.6 bn
- Growth
- 0.6%
- Direct investment
- USD 43.1 bn
Source: World Bank, GDP growth (annual %), series NY.GDP.MKTP.KD.ZG. Data: 2025 (rows for the United Kingdom, the United States and Canada retrieved on 25 October 2026). Retrieved on 10 August 2026. Direct investment: World Bank, foreign direct investment, net inflows (balance of payments, current US dollars), series BX.KLT.DINV.CD.WD.
Four developments are real. First, nearshoring: with 17.0% of all US trade in goods, Mexico is the largest trading partner of the United States, ahead of Canada at 12.9% and far ahead of China at 6.6%, measured for the month of June 2026. Second, Guyana, which has become an oil producer from a standing start and whose neighbours benefit along with it. Third, Paraguay’s cheap and clean electricity, which is attracting industry that needs energy. Fourth, Brazil’s agribusiness, which has long been among the best in the world technically. On top of that comes Argentina’s reform attempt, which is real and whose outcome remains open.
And now the brake. Paraguay’s 6.6% growth is impressive, but in the same year Mexico grew by 0.6% and Uruguay by 1.8%, in other words at or below the pace of mature economies: the United Kingdom grew by 1.4%, Canada by 1.7% and the United States by 2.2%. There is no such thing as uniform Latin American growth. In direct investment, Brazil attracts USD 77.7 billion, more than any other country in the region and more than Canada at USD 70.1 billion, but only about a quarter of the United States at USD 307.0 billion. Panama came to USD 0.9 billion.
Above all, the middle-income trap is real: several of these countries have been almost exactly where they are today for decades. Moving up is possible, it is just not a given. So my advice: do not choose a country because of a growth rate. Growth is a pleasant tailwind, not a reason for a life decision. The reasons are in the other eight chapters.
Where growth does matter to you is on a small scale. For northern Mexico, nearshoring means in concrete terms that industrial land, housing and skilled workers are getting scarce and prices there are rising faster than the national average. Paraguay’s cheap electricity means businesses are arriving that need staff. Guyana’s oil means the neighbouring countries pick up contracts and workers. Movements like these decide between cities and neighbourhoods, not between countries. And if you buy property because a region is booming, ask yourself whether you would still want to keep it when the commodity cycle turns, because in this region it always has.
Chapter 6
A continent that does not trust the state
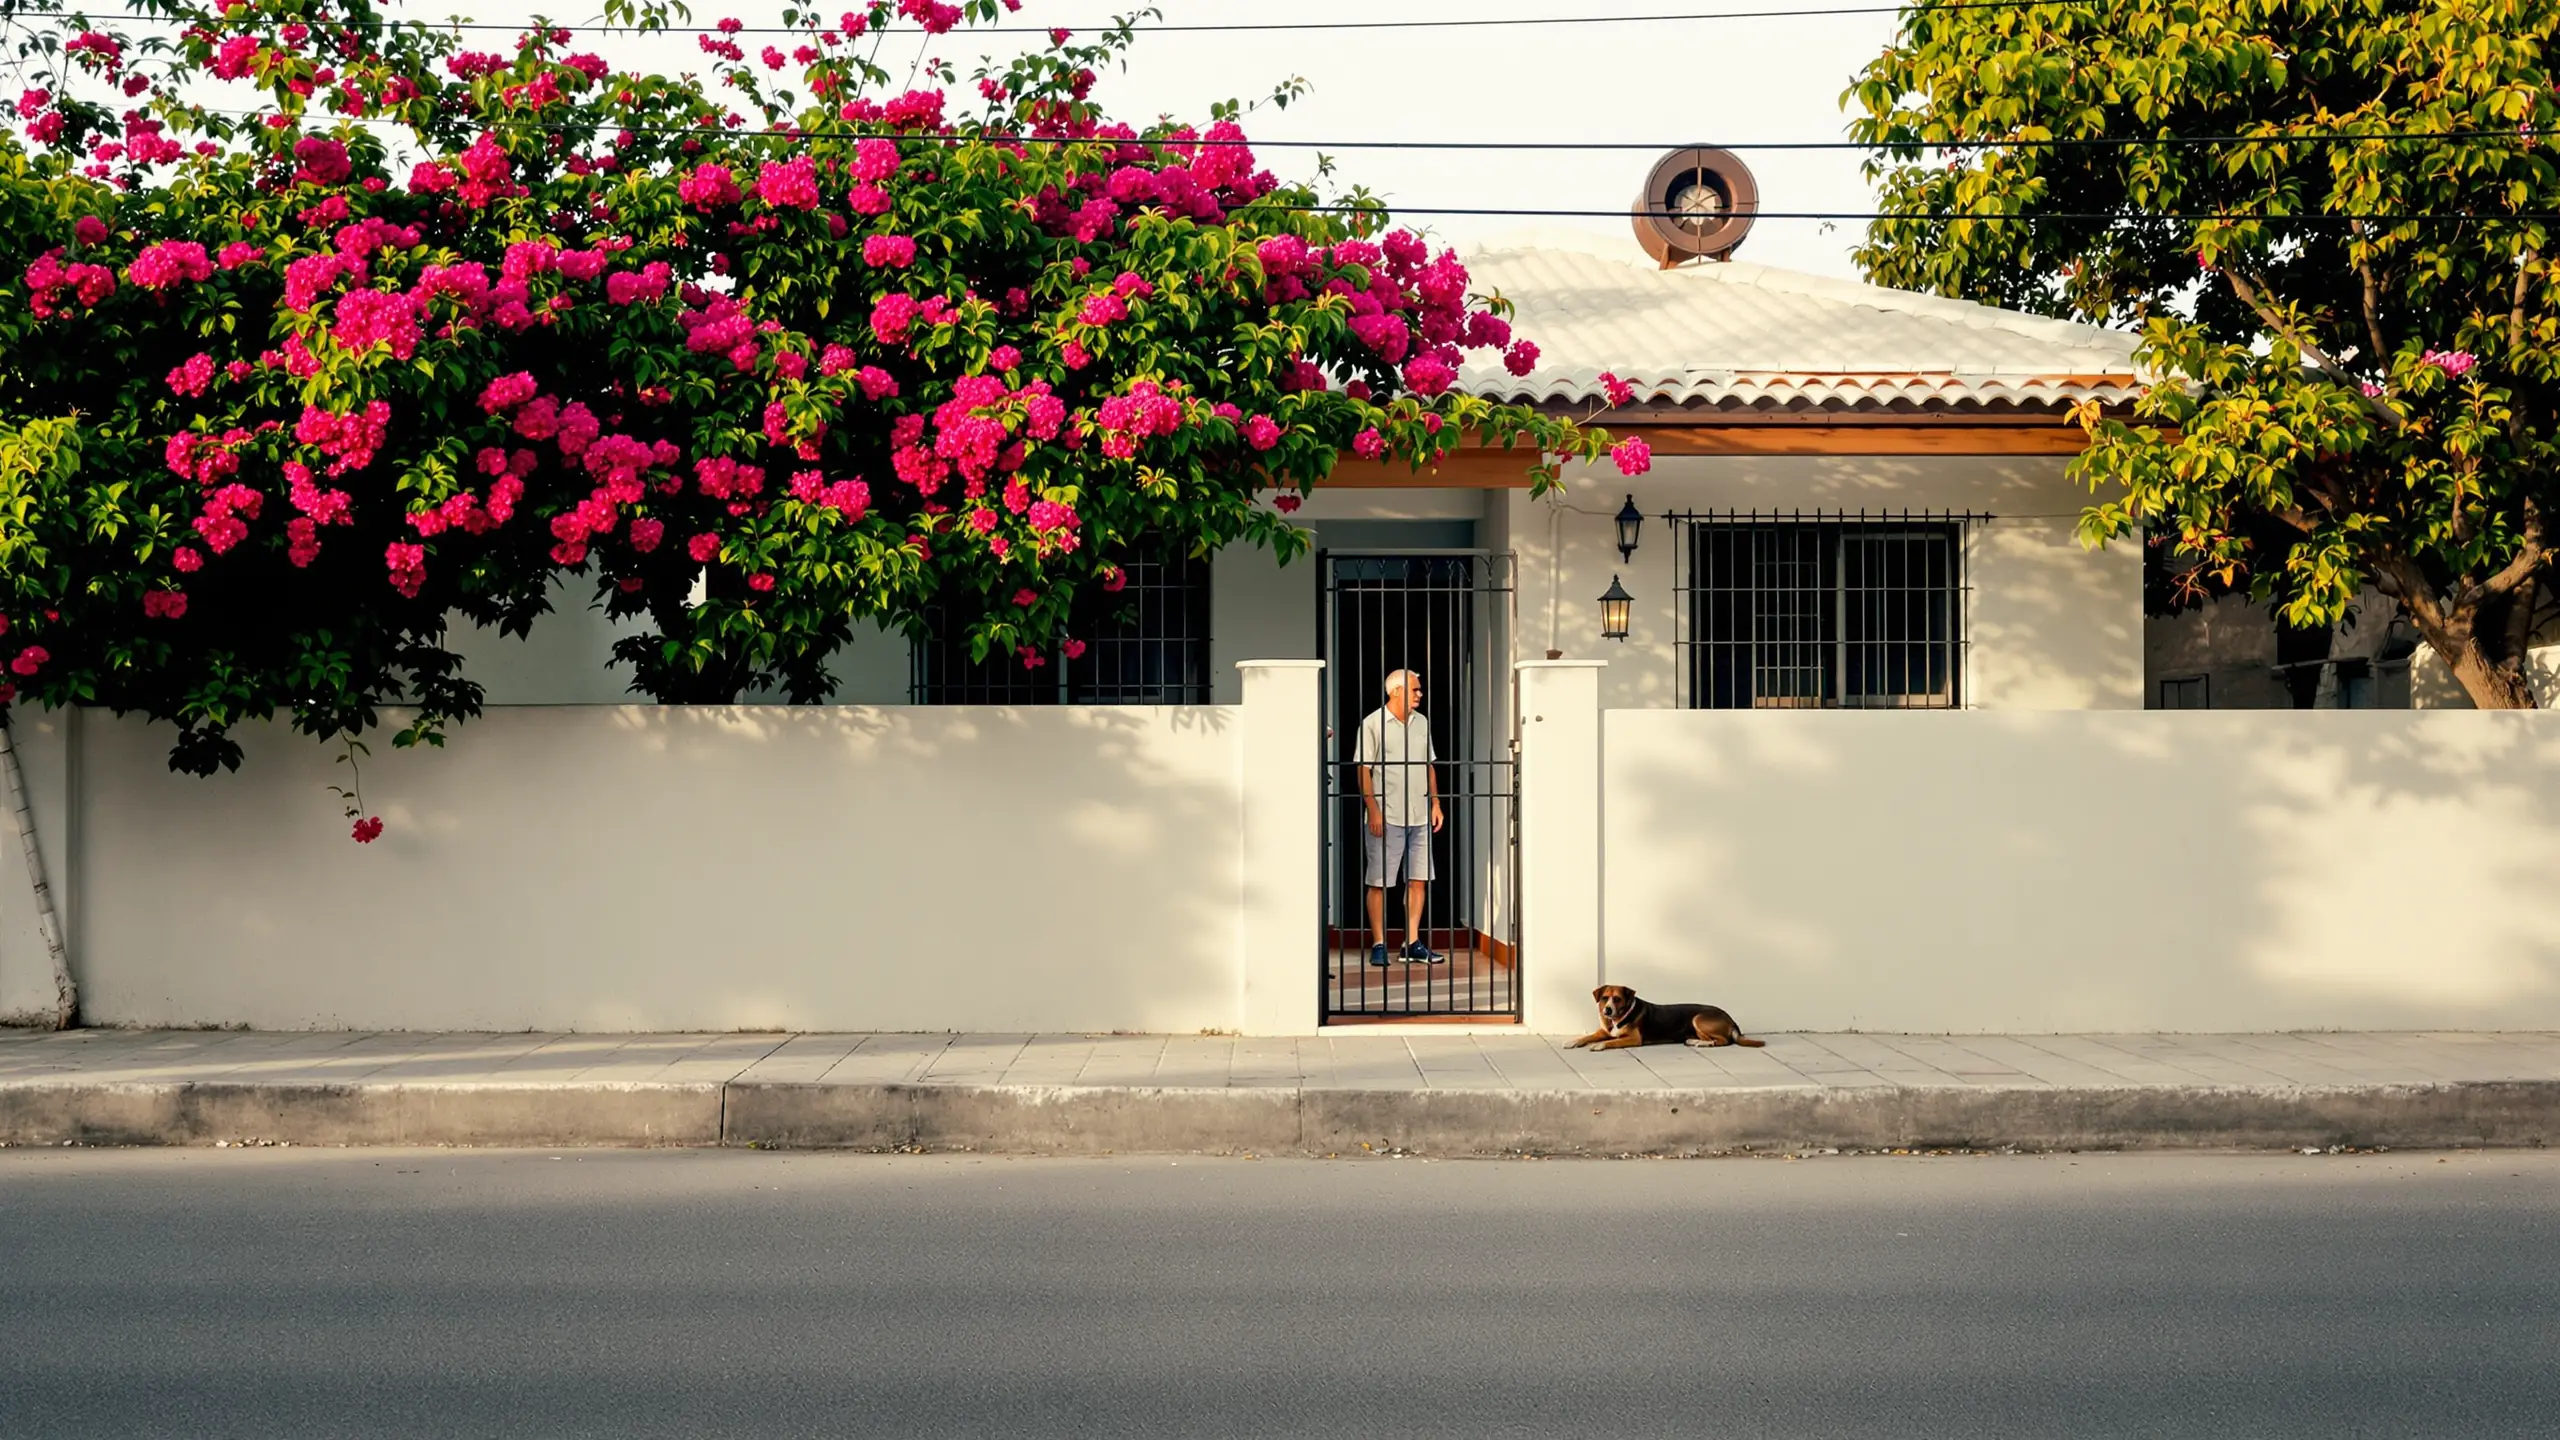
For me this is the most important chapter, and it is the one with the least to do with sunshine. In Latin America you live in societies that have learned not to believe their own state, because it has proved them right more than once.
That is not ideology, it is experience. Argentina has lived through hyperinflation, expropriations, capital controls and, in 2001, the corralito, when perfectly ordinary people could no longer get at their own money from one day to the next. Brazil froze its citizens’ savings in 1990. Ecuador closed its banks in 1999 and then abolished its own currency. In Europe these are chapters of economic history. There, they are the experiences of the people sitting next to you on the bus.
And that experience shapes behaviour. People hold assets outside the banking system. They buy land rather than securities. They make sure someone in the family has a second passport. They spread income across several jurisdictions instead of putting everything in one. None of this is seen as exotic or shady there. It counts as basic hygiene, like home contents insurance.
For once, the scale of this behaviour can be put in exact figures, because Argentina’s statistics office publishes it itself. As of 31 March 2026, Argentine residents held USD 269 billion in cash and deposits abroad, the largest single item of their total foreign assets of USD 499 billion. On the same date, the foreign currency reserves of Argentina’s central bank stood at USD 42 billion. So citizens hold more than six times as much in foreign currency as their own state owns.
You see this attitude in daily life once you know what to look for. Families hold a house or a piece of land, because neither shows up on a bank statement. Savings are kept in a currency that is not their own. Those who can afford it have children or grandchildren with a second passport, often an Italian or Spanish one, because the grandparents were immigrants. And nobody keeps all of their income in a single jurisdiction if they can avoid it. That is not tax evasion, it is the memory of the day the bank stayed shut.
For me, that is why advice works differently in Latin America than in Europe. In Europe, clients ask how to lower their tax bill. In Latin America, people first ask what happens if it all goes wrong. That is the better question, and it leads to more robust solutions. A plan that only works in fair weather is quickly recognised there for what it is.
If you come from a country where institutions have worked for as long as anyone can remember, you are a beginner on this subject. That is not meant disparagingly, it is simply how it is. Savers in stable countries have spent generations watching institutions keep their promises, and from that they have developed the habit of leaving everything in one place: account, portfolio, property, pension, insurance, residence, citizenship. Everything in a single jurisdiction, everything within reach of the same hand. An Argentine finds that unimaginably reckless, not out of paranoia but because their experience was different.
I say this without any gloating, because that trust was justified for a long time. But recent years have shown in Europe too how quickly rules can change when a government decides the situation requires it: borders, access to public spaces, cash limits, reporting duties, access to accounts under sanctions. None of that compares with hyperinflation, and that is not the point. The point is recognising that the framework can change, and whether your life is built to withstand a change in the framework.
What is also different in Latin America is the relationship with authority itself. An instruction from above is not debated there as an imposition but treated as information you build into your planning. Outrage is rare, adaptation is quick. If you come from a high-trust country, that is irritating at first, because it looks cynical. After a while you notice that it is not cynicism but a very sober form of realism, and that people there handle uncertainty better than we do, because they have priced it in.
That is why I say Latin America does not just change where you live, it changes your basic assumption about security. After two years there you think in options instead of states. You no longer ask whether something will happen, but what you will do if it does.
And now the price, which has to be named clearly, once and without apology. The freedom you feel there is a product of a weak state. The state leaves you alone because it does not have the capacity to pursue you. But that same weak capacity also means roads that do not get repaired. Courts that take three years to reach a judgment. A land registry that cannot get an old mistake corrected. Police who either do not come or whose arrival you would rather not see. A public hospital you do not want to go to. It is the same set of facts, seen from two sides, and you cannot pick just one half of it.
There is one observation about this trade-off that I have made again and again over twenty years. People who arrive from orderly, rule-bound countries spend their first year annoyed by exactly the things that, by their third year, make them never want to go back. That nobody checks up on you is unsettling at first and later the best thing about the whole country. That neighbours settle things between themselves instead of calling the council looks at first like a lack of order and later turns out to be a different order, one built on relationships rather than on responsibilities. If you are willing to enter that system of relationships, you will get on well. If you expect an office to solve your problem, you will wait a long time.
And one more thing is part of the truth: the weak state does not protect you either. There is no functioning deposit insurance you could rely on in every one of these countries. There is no regulator that saves you from a bad contract. There is no consumer protection that gets your money back. You have to be more of a grown-up there than you need to be in Europe, with everything that is good and tiresome about that. That is exactly why preparation matters so much, and exactly why you do not do the decisive things there alone.
If you understand this trade-off, you will make very good decisions in Latin America. If you think you will get Northern European administration at a Paraguayan tax rate, you will be disappointed, and quickly. We deliberately do not go deep into tax here. One question you should answer before anything else is what your home country keeps taxing once you leave, and that depends on where you come from:
Chapter 7
Protected, but in the backyard
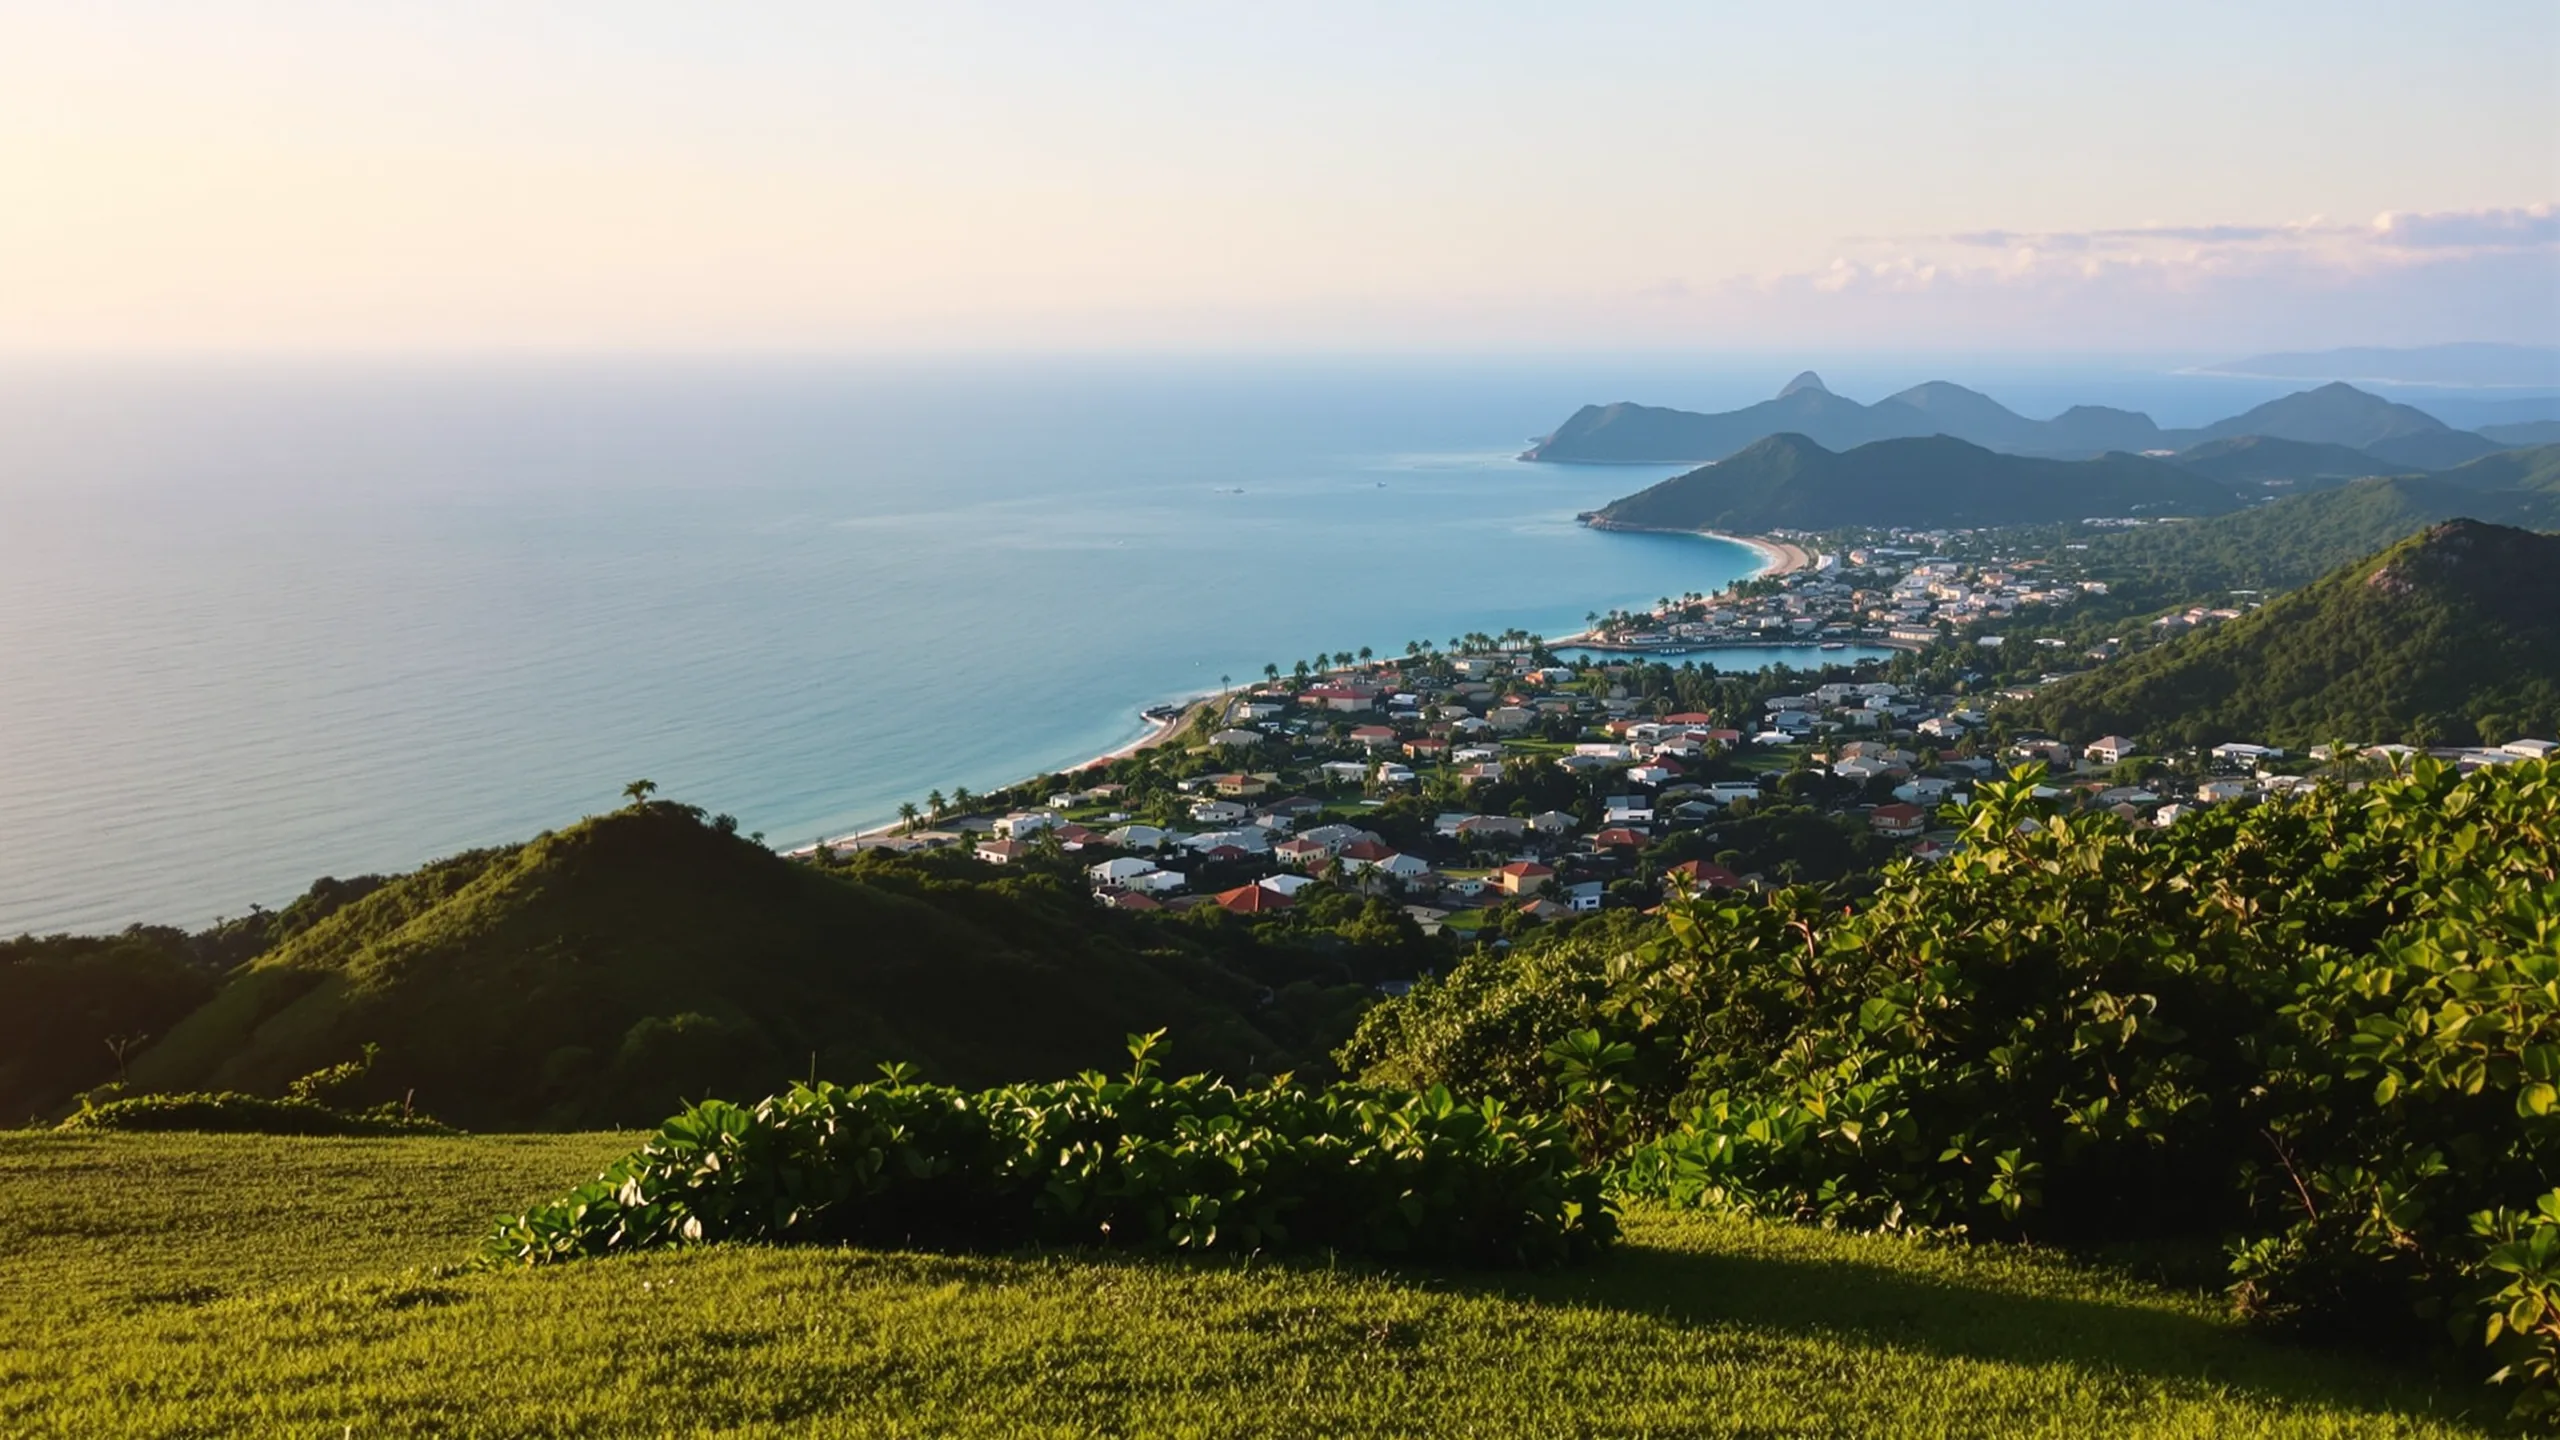
There is a geographical advantage that hardly anyone talks about, because it seems too obvious. Latin America lies structurally outside the line of fire. The fault lines of our time run between the United States and China, between Russia and Europe, right through the Middle East and across Taiwan. None of them runs through the Southern Cone of South America. There is no alliance border there where two great powers face each other, and no sea lane whose closure would start a war.
What that means in daily life only becomes clear once you have the comparison. There is no debate about conscription for your sons. There is no discussion about how many days of gas reserves the country has left. There is no airspace closed because of foreign drones, and no border with troops lined up along it. These are all absences, and absences go unnoticed by anyone used to them. Much of Europe no longer has them.
This calm has a name, and the name is the Monroe Doctrine. Since 1823 the United States has regarded the Western Hemisphere as its sphere of influence and kept other great powers out of it. For people living in the region that cuts both ways, and both edges are very visible right now.
The US National Security Strategy of November 2025 devotes its own section to the region and explicitly calls it a Trump Corollary to the Monroe Doctrine. It says the United States will reassert and enforce the doctrine to restore its pre-eminence in the Western Hemisphere, and deny competitors from outside the hemisphere the ability to station forces there or own strategically important assets. The document also names targeted operations against cartels, explicitly including lethal force, and an expanded Navy and Coast Guard presence.
What that means in practice has since become clear. In January 2026 the United States intervened militarily in Venezuela and took Nicolás Maduro into custody. In a statement of 3 August 2026 the US State Department describes the situation as a three-phase plan of stabilisation, economic recovery with political reconciliation, and a transition to democratic elections, accompanied by talks between the interim government and the National Assembly elected in 2015. Nobody knows today how it will end.
The Monroe Doctrine is nothing new, it is two hundred years old and has simply been interpreted more or less strictly over time. The region’s experience with it has been mixed to bitter, and that is exactly why Latin American governments react to American announcements the way they do: reserved in public, cooperative in practice. If you want to understand the region, do not mistake this double movement for insincerity. It is the survival strategy of small states next to a very large power.
I am writing this at such length because both halves have to be right. No great-power war is coming to the Southern Cone: Uruguay, Paraguay, Chile and Argentina are as far from any front line as almost any inhabited place on earth. At the same time, American pressure hits the region first, and the history of that is long, from Guatemala in 1954 through Chile in 1973 and Panama in 1989 to Venezuela in 2026.
For you as a private individual this does not mean tanks are coming. It means the pressure shows up in the things your daily life touches: sanctions lists, banking relationships, payments in US dollars, visa rules, drug policy.
The most important of these channels is the least conspicuous. Almost every transfer in US dollars passes through an American bank at some point, and therefore through a legal system Washington controls. When a country comes under pressure, its residents rarely feel it at a roadblock. They feel it when their bank suddenly stops forwarding payments, when opening an account takes six weeks, or when a payment provider drops the country from its list. That is exactly why in our work the banking question comes early, and not at the end.
It is worth turning the perspective around for a moment. For fifty years Europe was the safe hinterland, and today it is the front line. Latin America was long the restless periphery, and today it is the hinterland of a great power that has no interest in anything there catching fire. That is no guarantee, and it is not a flattering position either. But it changes the question of where a private individual is actually more exposed today.
That is why choosing a country is not a matter of taste. A country in open conflict with Washington is a different risk for a private individual from one that cooperates with Washington, even when both sit side by side on the same map. You will find an overview of every country in the region under all Latin American countries, and the twelve we work in under Countries.
Chapter 8
They still let you in
While Europe is closing its doors, in Latin America they stand open. Residence there is cheap, legally simple and permanent within a manageable time, and after that a clear path leads to citizenship. The waiting periods are short compared with anything you know from Europe.
Usual minimum period from legal residence to eligibility to apply, eight examples.
These periods are minimums, not processing times, and they assume genuine presence in the country. The second column shows how the years are counted.
| Country | Residence to naturalisation | How the years count |
|---|---|---|
| Argentina | 2 years | from the first temporary residence, with no departures (rule disputed) |
| Peru | 2 years | 2 yrs from the first residence under Ley 26574; 5 yrs once Ley 32421 is in force |
| Paraguay | 5 years | 2 yrs temporary + 3 yrs permanent (3 yrs with direct PR) |
| Chile | 5 years | from the first temporary residence (around 2 yrs until the Definitiva) |
| Mexico | 5 years | from the first residence, temporary counts (2 yrs for Latin Americans) |
| Uruguay | 5 years | from taking up residence |
| Panama | 5 years | from permanent residence (Pensionado, Investor directly; Friendly Nations 2 + 5 = 7) |
| Brazil | 6 years | up to 2 yrs fixed-term + 4 yrs indefinite (4 yrs with indefinite residence from the start) |
- Residence
- 2 years
- How the years count
- from the first temporary residence, with no departures (rule disputed)
- Residence
- 2 years
- How the years count
- 2 yrs from the first residence under Ley 26574; 5 yrs once Ley 32421 is in force
- Residence
- 5 years
- How the years count
- 2 yrs temporary + 3 yrs permanent (3 yrs with direct PR)
- Residence
- 5 years
- How the years count
- from the first temporary residence (around 2 yrs until the Definitiva)
- Residence
- 5 years
- How the years count
- from the first residence, temporary counts (2 yrs for Latin Americans)
- Residence
- 5 years
- How the years count
- from taking up residence
- Residence
- 5 years
- How the years count
- from permanent residence (Pensionado, Investor directly; Friendly Nations 2 + 5 = 7)
- Residence
- 6 years
- How the years count
- up to 2 yrs fixed-term + 4 yrs indefinite (4 yrs with indefinite residence from the start)
Source: VidaLibrePlan, Latin America naturalisation dataset, every row checked against the nationality law, the constitution or the migration authority. Data: primary source for each country noted in the dataset. Retrieved on 8 August 2026.
And the passports are not worthless: Chilean, Argentine, Brazilian and Uruguayan travel documents open large parts of the world without a visa.
The contrast with Europe is sharp by now. In much of Europe, the requirements for naturalisation and residence have moved in one direction in recent years, and the trend keeps pointing that way. A residence permit in Latin America, by contrast, costs a manageable sum, a few certified documents and patience, and in several countries it becomes permanent after a short time. That is the reason we talk about this region at all: not because it is perfect, but because it is within reach.
Two things have to be said honestly. First, short waiting periods are not short procedures: the authorities take their time, and the application only starts once the period has been served. Second, almost all of these routes require genuine presence in the country, and more of it than the marketing copy says. A residence card in a drawer keeps your residence alive. It does not lead to a passport.
Nothing more is needed at this point. The point is the door, not the door handle. If you want to compare the periods of every country in detail, you will find the full comparison in naturalisation in Latin America compared.
Chapter 9
The other side. And who it is not for.
If you have read this far, you know my enthusiasm. Now comes the part I bring up in every first conversation, because it saves more people from an expensive mistake than anything else.
Let us start with what everyone asks first. Yes, violence is an issue, and a very unevenly distributed one.
Latest internationally comparable year for each country. The reference year is in the second column, because it differs.
This series is comparable but not up to the day. Two countries have moved sharply since, in opposite directions, and that is set out below the table.
| Country | Per 100,000 people | Reference year |
|---|---|---|
| United Kingdom | 1.1 | 2021 |
| Canada | 2.0 | 2023 |
| Argentina | 4.5 | 2023 |
| United States | 5.8 | 2023 |
| Chile | 6.4 | 2023 |
| Paraguay | 6.8 | 2023 |
| El Salvador | 7.9 | 2022 |
| Peru | 8.6 | 2021 |
| Uruguay | 11.3 | 2023 |
| Panama | 11.7 | 2023 |
| Costa Rica | 17.8 | 2023 |
| Brazil | 19.3 | 2023 |
| Colombia | 24.9 | 2023 |
| Mexico | 24.9 | 2023 |
| Ecuador | 45.7 | 2023 |
United Kingdom
- Per 100,000
- 1.1
- Year
- 2021
Canada
- Per 100,000
- 2.0
- Year
- 2023
- Per 100,000
- 4.5
- Year
- 2023
United States
- Per 100,000
- 5.8
- Year
- 2023
- Per 100,000
- 6.4
- Year
- 2023
- Per 100,000
- 6.8
- Year
- 2023
- Per 100,000
- 7.9
- Year
- 2022
- Per 100,000
- 8.6
- Year
- 2021
- Per 100,000
- 11.3
- Year
- 2023
- Per 100,000
- 11.7
- Year
- 2023
- Per 100,000
- 17.8
- Year
- 2023
- Per 100,000
- 19.3
- Year
- 2023
- Per 100,000
- 24.9
- Year
- 2023
- Per 100,000
- 24.9
- Year
- 2023
- Per 100,000
- 45.7
- Year
- 2023
Source: World Bank, intentional homicides per 100,000 people, series VC.IHR.PSRC.P5, from UNODC. Data: 2021 to 2023, by country (rows for the United Kingdom, the United States and Canada retrieved on 25 October 2026). Retrieved on 10 August 2026.
Two movements since those reference years are too large to leave out. El Salvador reports a national rate of 1.3 per 100,000 people for 2025, a fraction of the figure in the table. This number comes from the country’s Attorney General’s Office. Its website could not be reached on 10 August 2026, so I will say it openly here: the figure is a national statement that I could not check against the original, and it stands next to the internationally comparable series, not in its place. It is also the result of a state of emergency with mass arrests, about which you are entitled to an opinion regardless of the statistics.
Ecuador is moving in the other direction. Ecuador’s Ministry of the Interior records 9,216 intentional homicides for 2025, the most violent year in the country’s history, concentrated on the coast around Guayaquil. A country that ten years ago was seen as one of the calmest in the region is today one of the most dangerous. If you are considering Ecuador, you need to know that and to distinguish between regions.
That names the pattern that holds for the whole continent: in Latin America, violence is not a feature of a country but of a neighbourhood. Two districts of the same city can differ by a factor of twenty. That does not make it harmless, it makes it manageable, through your choice of city, neighbourhood and way of life. If you are not willing to manage that, you should not come.
What else belongs honestly on the table, in the order in which it actually catches up with people:
- Distance from your parents. In my experience this is the most common reason for going back, not taxes and not crime. A long-haul flight is bearable as long as everyone is healthy. It becomes very hard to bear when a parent needs care.
- Petty corruption. Not the big scandal, but the official who leaves your file lying until somebody takes care of it. You get used to it, and some people do not want to get used to it.
- Currency and inflation. If you earn locally, you carry local risk. If you earn in a hard currency you have the advantage, but you should know that exchange rates move in both directions.
- Healthcare. Private care in the larger cities is good to very good, and affordable. In the countryside it is thin, and in a real emergency what counts is the distance to the nearest clinic, not the price.
- Schools. Good private schools exist, but not everywhere, and in effect they help decide where you live. If you move with school-age children, choose the school first and then the city.
- Bureaucracy without logic. Not much of it, but unpredictable. A procedure takes two weeks or eight months, and nobody can tell you in advance which.
And then the sentence that really ought to sit above this whole page: Latin America is not a country, and not a unit either. Uruguay and Honduras have almost nothing in common apart from the language. Chile and Bolivia are neighbours and different worlds. Panama City and the Paraguayan Chaco lie on the same continent and in different centuries. That is exactly why we keep separate pages for more than twenty countries instead of one text about a continent.
Which leaves the most honest question: who is this not for?
It is not for you if you value reliability more than freedom. If an unannounced power cut throws you, if you expect appointments to be kept, if a trip to a government office that fails three times makes you angry rather than amused, then in Latin America you are trading calm for friction, and that is not worth it for you.
It is also not for you if you are not willing to learn the language. Without Spanish or Portuguese you live in a bubble of translators and fellow expats and never really arrive. It is not for you if your income is tied to a particular place back home. It is not for you if you need ongoing treatment that depends on specialist clinics. And it is not for you if you are running away from something rather than towards something: moving does not solve problems, it only changes the scenery.
If you have read all of this and your first thought was, that sounds demanding, but it sounds like a life that belongs to me, then we are talking about the same thing.
Which country fits your situation?
Nine chapters answer the question about the continent. The question about your country is not answered on a website but with your numbers, your family and your timetable. Tell us where you stand, and you will get a concrete assessment.